Power BI is a business intelligence (BI) and analytics tool that can connect data from many sources to create interactive dashboards and reports. Users can view standardized reports and explore data for business insights.

Why Use Power BI
The goal of implementing Power BI is to provide a modernized tool for data consumers. In the past, standardized reports and queries were created by the software development team and made accessible through EZ Access and Hyperion, both of which are legacy systems that require customization, and resources for support are scarce. In an effort to decrease time-consuming report development cycles, the transition to Power BI as a campus reporting tool will provide efficient, fast, accurate access to campus data. Power BI also allows users to sort and filter, customize views, explore visualizations, and export to Excel, PDF, and PowerPoint for further analysis or presentations.
Reports Available in Power BI
Power BI reports for Data Warehouse are based on selected EZ Access and Hyperion web reports. The following table shows the available reports with the respective app names:
| App Names | Descriptions | Report Groups |
| Campus UCPath Reporting | The reports available in this app are based on UCPath data. These reports include but are not limited to employee, position, funding, and payroll information. Additional UCPath data driven reports will be added over time based on business needs and priorities. |
|
| Legacy Financial Reporting | Selected Hyperion Web reports have been transitioned into the Legacy Financial Reporting app. These reports include but are not limited to fiscal close fund balances, extramural revenue, cost center information, general ledger transaction detail and summary information, etc. As we continue to transition Hyperion Web reports, additional reports will be added over time. |
|
| Control Point Dashboard | This dashboard presents financial amounts summarized at the department Account-Fund-Sub-Object level. Individual transactions, employee details, plant accounts/funds, and liens are not available in these reports. The Control Point Dashboard provides the information to analyze campus financial data and the fiscal health of the campus, divisions, individual departments, accounts, and funds. |
|
How to Access Reports
UCSB has a campus-wide license for Power BI and anyone with an active UCSBNetID and password can sign in to the Power BI service using the links under the App Names provided above using a web browser. There is no need to download or install the desktop version which is known as "Power BI Desktop". To see any data in these applications you must be granted access:
- Request data access; and
- Enroll in multi-factor authentication (MFA)
Request Data Access
To request data access, please submit this access request form.
The form is embedded with automated approval workflows that route the request to the appropriate approver(s). If the request is for departmental data, the form will be routed to the departmental approver for review and approval. If the request is for campus-wide data, the form will be routed to the departmental approver and also the campus-wide data owners for review and approval.
- Departmental Approver
- Provided by the person submitting the form
- Departmental Security Administrator (DSA), Business Officer, manager, or department head
- Campus-wide Approvers
- Default setting and automated
- Heads of Human Resources, Academic Personnel Office, and Business & Financial Services
Enroll in Multi-Factor Authentication (MFA)
Multi-factor authentication is required for signing into the Power BI Service at UCSB, and Duo Security is the UCSB partner for MFA. Please visit the hyperlinked webpages for more information and to enroll in MFA.
Sign in to Power BI
The following steps are intended for accessing the Power BI Apps provided by the Data Warehouse team:
1. Go to this link and click on the "sign in" button. You will be directed to the Microsoft sign in screen.
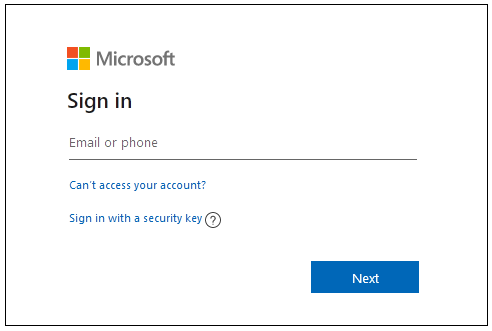
2. Enter the email address associated with your UCSBnetID (xxxxxx@ucsb.edu), then click "next."
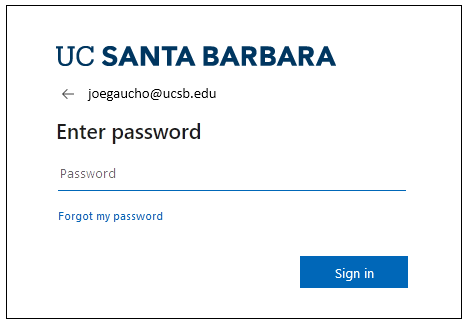
3. Enter the password for your UCSBnetID, then click "sign in."
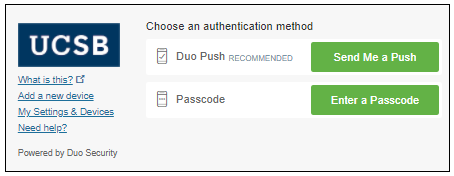
4. You will be prompted to choose an authentication method by Duo Security. You can either get a "push" from Duo, or you can enter a passcode from the Duo app.
Viewing Reports
After logging into Power BI Service, you will need to locate the app(s) for the reports you intend to view. To locate an app, click on "Apps" on the left sidebar > click on the "Get apps" button on the upper right corner > select the app or search by app name using the search box on the upper right corner.
Once you have selected an app, the navigation bar on the left of the screen will list the data categories visible to you based on the access and permissions for which you were provisioned.
Click on a data category to expand the list of reports, then select a report that you would like to view. If there are multiple pages or if there are a sub set of reports, there will be tabs at the bottom of the screen visible to you when the report is open.
Filter and Sort Features
When a report is open, the most common filters are available at the top and additional filters are displayed on the navigation bar on the right of the screen. Filter fields will vary depending on the report content and the filter selections you have chosen will be the default view the next time you open the same report.
There are also different types of filters. For example:
- Check box filters
- Click on the down arrow to open the dropdown box and select values.
- Click on the up arrow to close the dropdown box.
- To clear the selections, hover the mouse over the filter field and an eraser icon will appear; click on the eraser to clear the field.
- Text Search filter
- In the search box, type in partial or full Employee ID or last name, then click on the magnifying glass.
- To clear the search entry, click on the eraser icon to the right of the search box.
- Date Search filter
- Select the default date or enter the search date in mm/dd/yyyy format.
- Select the default date or enter the search date in mm/dd/yyyy format.
The sort feature is located in the table header row. To sort data, hover the mouse over the table header and the sort arrow will appear. Click on the arrow to sort the desired column.
- To clear the sort order, refresh the internet browser and the report view will revert back to the filter selections.
- If you would like to reset all filtering and/or sorting, you can click the “Reset” icon in the upper right of the ribbon.
Downloading Results
There are multiple ways to download report results from Power BI:
- General download to Excel: Click on the 3 dots on the upper right side of the report, and then select “Export Data”
- Other options are available on the upper left of the ribbon bar using the “Export” menu
Additional Resources